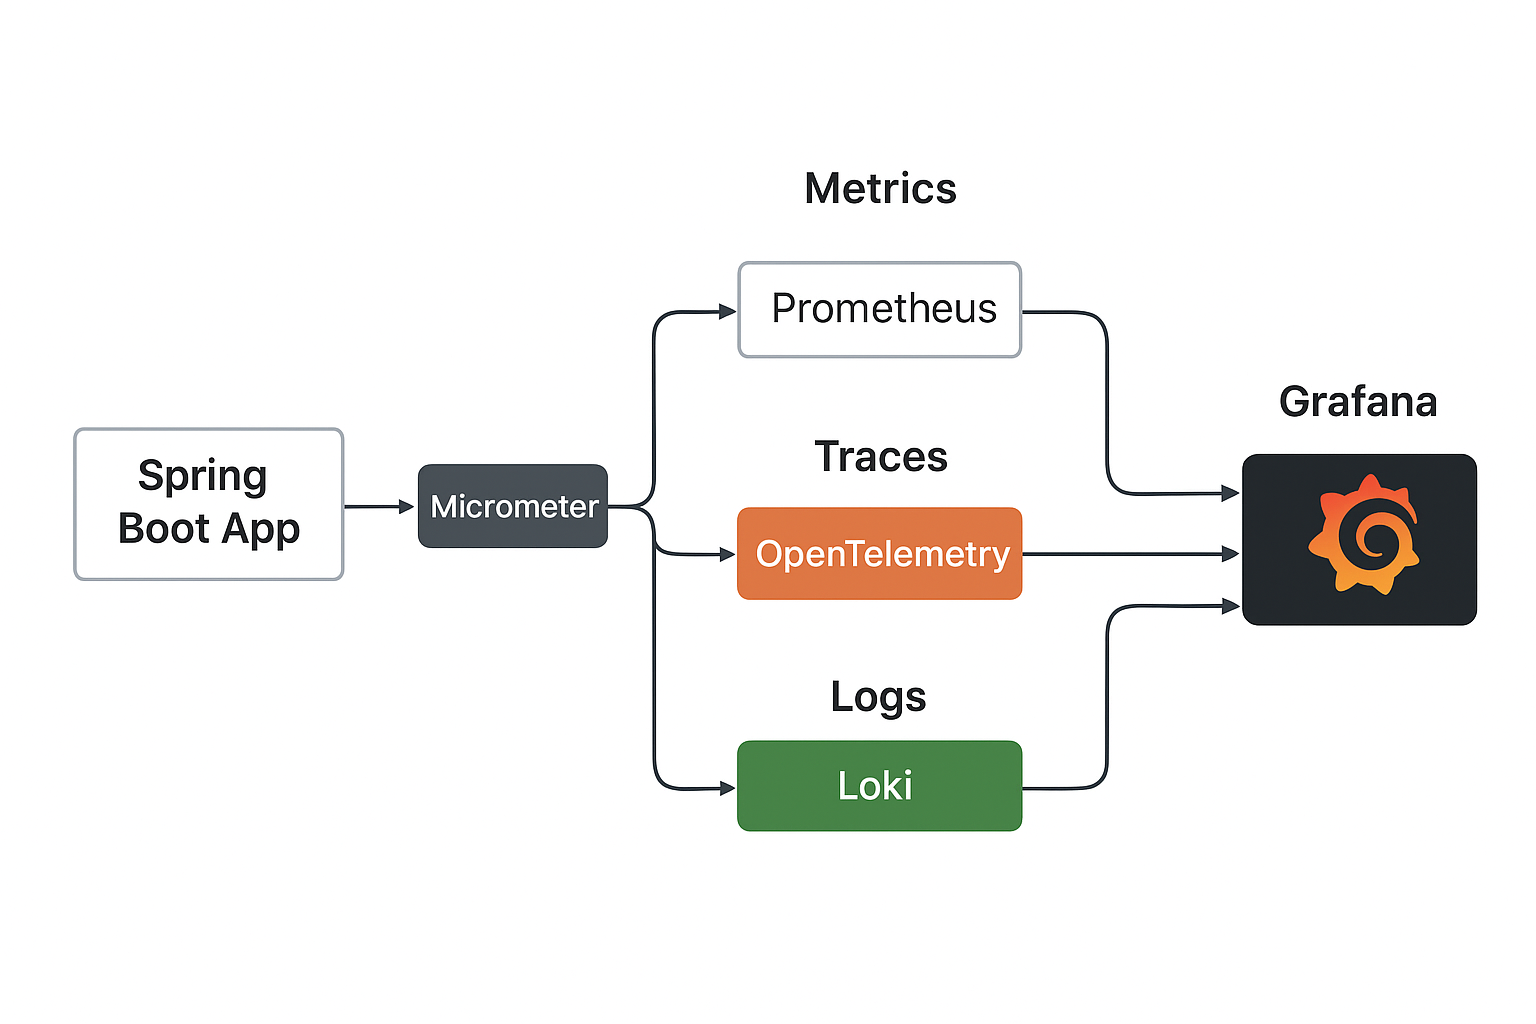
Observability Dashboard Screenshot

Observability and Monitoring

Observability and Monitoring in Modern Spring Boot Applications Modern distributed systems are complex — dozens of services, asynchronous communication, and dynamic scaling make understanding what’s happening inside the system harder than ever. That’s where Observability and Monitoring come in. While Monitoring tells us that something is wrong, Observability helps us understand why it’s wrong. In a typical Spring Boot microservice setup, observability involves 3 core pillars: 🧭 1. Metrics — Quantifying System Health Metrics give a numerical insights about system behavior — CPU usage, request latency, error rates, etc. ...
October 17, 2025
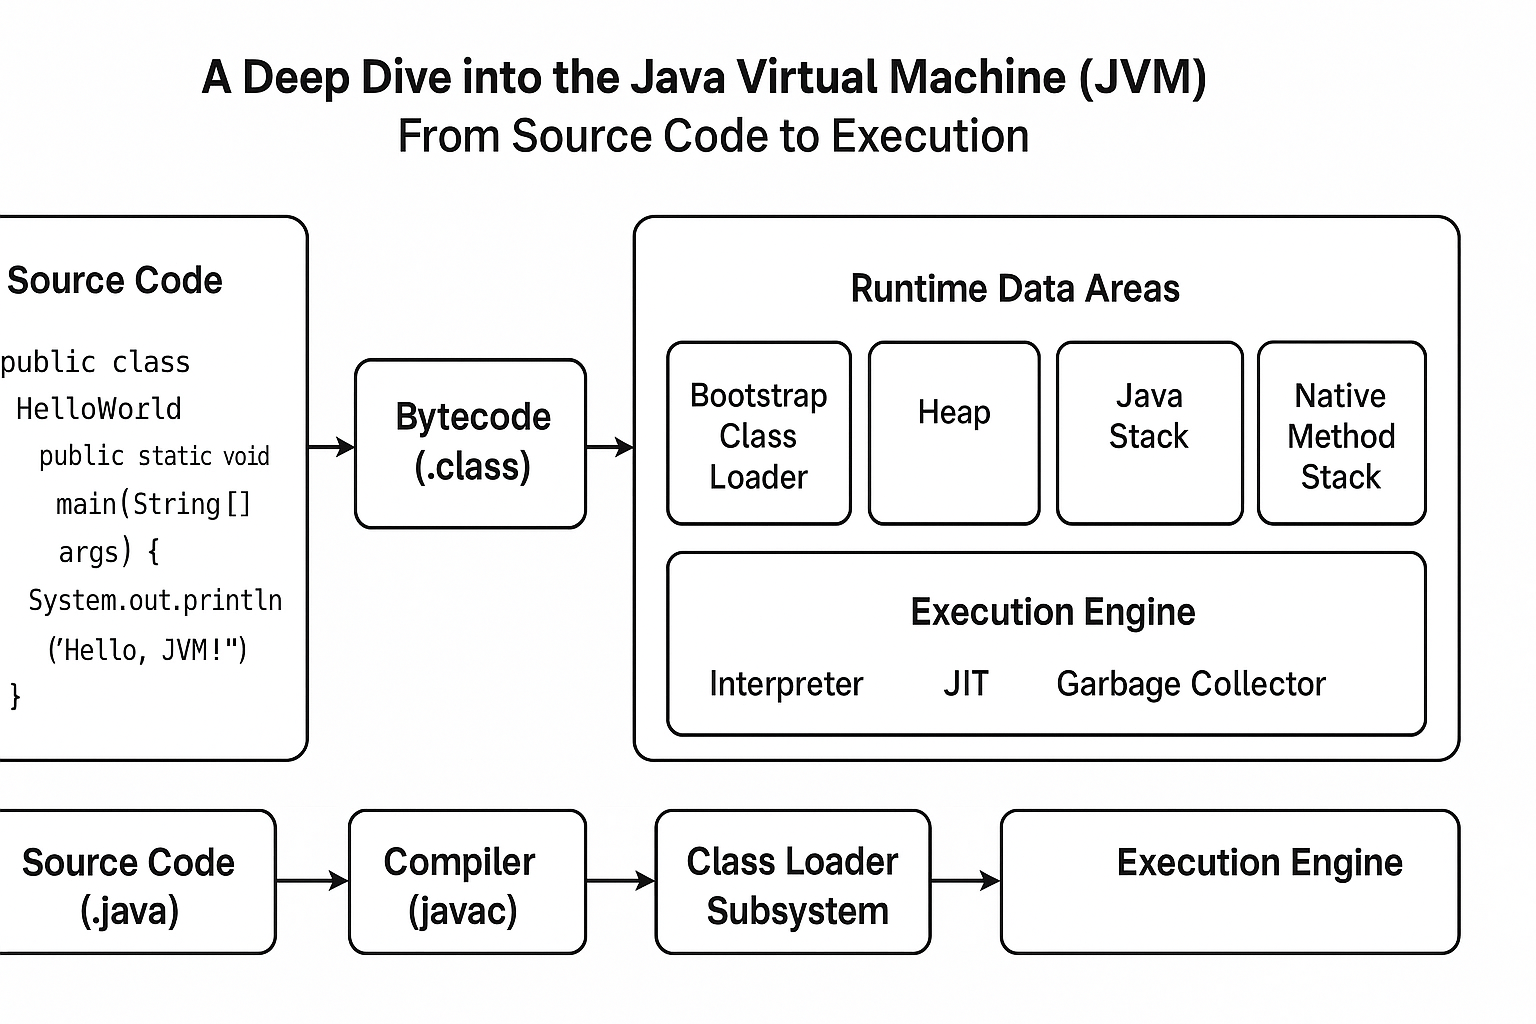
Java Virtual Machine Diagram

JVM Deep Dive

A Deep Dive into the Java Virtual Machine (JVM): From Source Code toExecution The Java Virtual Machine (JVM) is at the heart of the Java ecosystem. It’s an abstract computing machine that enables Java applications to run anywhere—without needing platform-specific recompilation. But how does Java code actually go from .java files to running processes? Let’s break down the full lifecycle. Source Code → Bytecode: Every Java program begins as source code written in .java files. These files are compiled by the Java Compiler (javac) into bytecode, stored in .class files. Source Code Example: public class HelloWorld { public static void main(String[] args) { System.out.println("Hello, JVM!"); } } Compilation Command: ...

October 13, 2025