Observability and Monitoring in Modern Spring Boot Applications
Modern distributed systems are complex — dozens of services, asynchronous communication, and dynamic scaling make understanding what’s happening inside the system harder than ever. That’s where Observability and Monitoring come in.
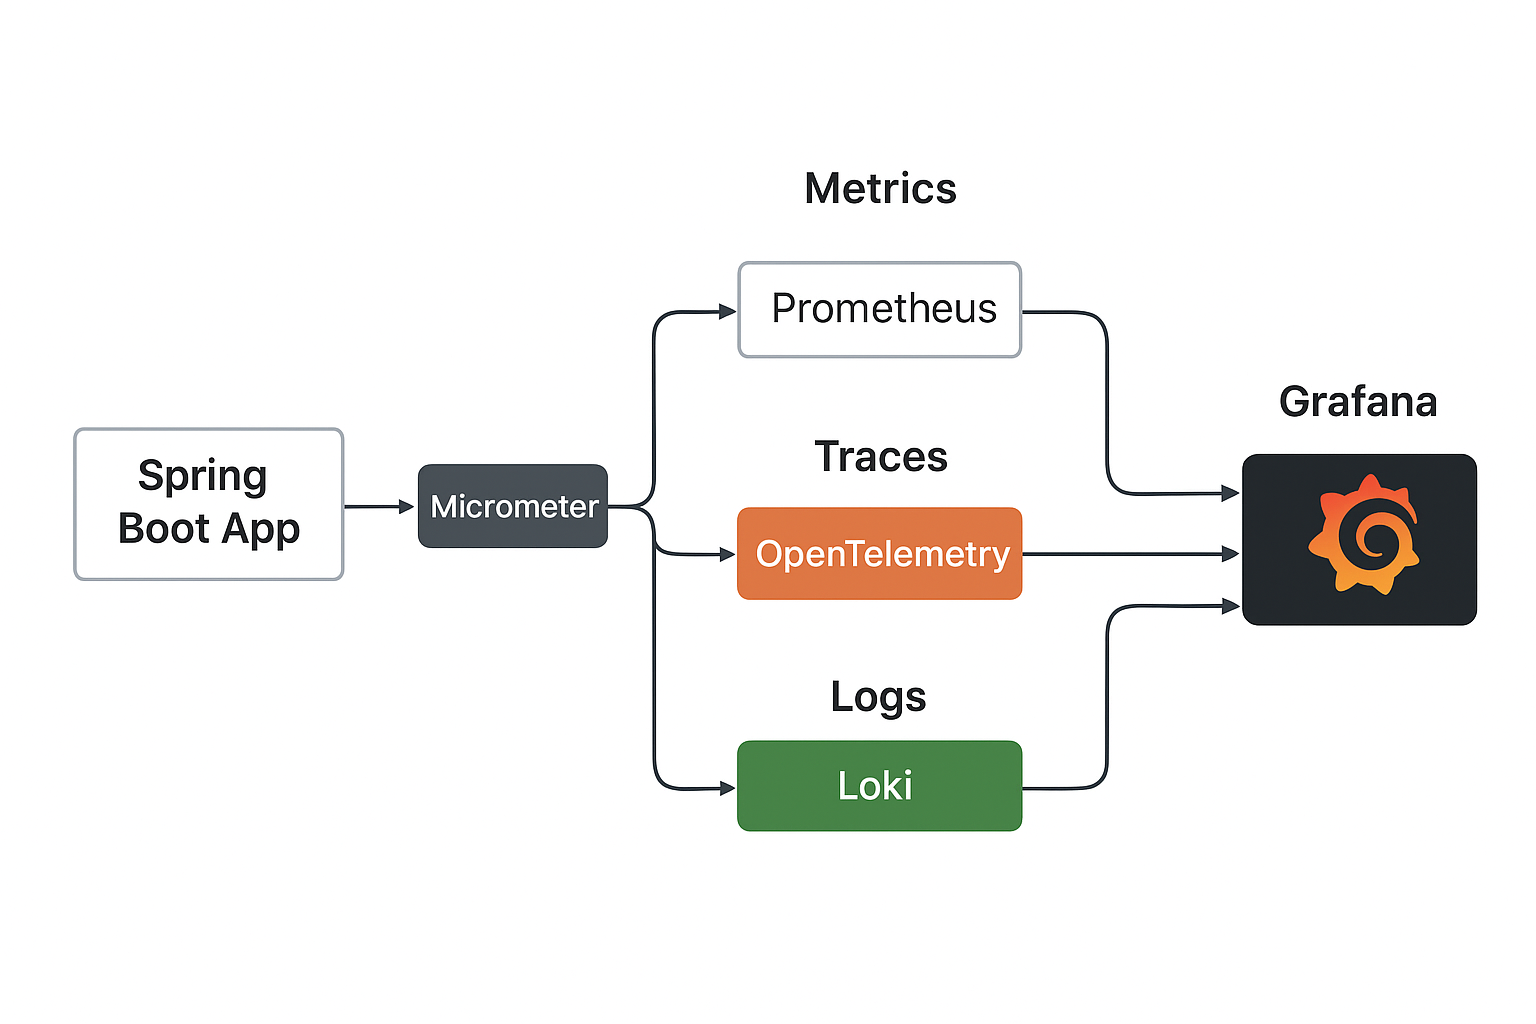
While Monitoring tells us that something is wrong, Observability helps us understand why it’s wrong. In a typical Spring Boot microservice setup, observability involves 3 core pillars:
🧭 1. Metrics — Quantifying System Health
Metrics give a numerical insights about system behavior — CPU usage, request latency, error rates, etc.
In a Spring Boot ecosystem, we can easily enable metrics using Micrometer:
<dependency>
  <groupId>io.micrometer</groupId>
  <artifactId>micrometer-registry-prometheus</artifactId>
</dependency>
Once added, the application automatically exposes metrics at the
/actuator/prometheus endpoint.
Prometheus regularly scrapes these metrics and stores them in its time-series database. From there, Grafana connects to Prometheus to visualize dashboards and create alerts.
✅ Metrics Pipeline Summary:
Spring Boot (Micrometer) → /actuator/prometheus → Prometheus → Grafana
This pipeline gives a real-time visibility into the application performance — we can chart request rates, error percentages, JVM memory, and more.
🔍 2. Traces — Following a Request Across Services
Metrics are great, but they don’t tell the story of one specific request. That’s where Distributed Tracing comes in.
With OpenTelemetry, the Spring Boot services can be automatically instrumented by adding the OpenTelemetry Java Agent or SDK.
This agent captures:
- HTTP client & server spans
- Database queries
- Messaging (Kafka, RabbitMQ) interactions
Traces are then exported in OTLP (OpenTelemetry Protocol) format to the OpenTelemetry Collector, which forwards them to Tempo, a distributed tracing backend.
Grafana integrates with Tempo, allowing to visualize traces and understand latency across microservices.
✅ Tracing Pipeline Summary:
Spring Boot (OpenTelemetry) → OTLP → OpenTelemetry Collector → Tempo → Grafana
This pipeline helps answer why a request was slow — bottlenecks can be pinpointed down to individual database calls.
🧾 3. Logs — Contextual Insights for Debugging
Logs capture the raw narrative of what’s happening inside the application. When properly structured and correlated with traces, they become a powerful debugging tool.
Using the Loki Logback Appender, the Spring Boot apps can send logs directly to Loki:
<dependency>
  <groupId>com.github.loki4j</groupId>
  <artifactId>loki-logback-appender</artifactId>
</dependency>
Each log entry is labeled (e.g., service=order-service, level=INFO) for fast
querying in Grafana. When integrated with OpenTelemetry, the logs also include
traceId and spanId in the MDC — allowing them to correlate logs with traces.
✅ Logs Pipeline Summary:
Spring Boot (Loki Appender) → Loki → Grafana
Now, a single Grafana dashboard can be used to:
- Visualize metrics trends
- Explore distributed traces
- Drill down into correlated logs
🎯 Bringing It All Together
When these three pipelines work in harmony — Metrics, Traces, and Logs — a full-stack Monitoring and Observability can be achieved.
Metrics  →  What’s happening?
Traces   →  Where is it happening?
Logs     →  Why is it happening?
Together, they form a feedback loop that enables proactive monitoring, faster incident resolution, and deeper insight into the system’s behavior.
🚀 Final Takeaway
Monitoring and Observability aren’t tools — they are a mindset. They are about building systems that tell their own stories. With Spring Boot, Micrometer, OpenTelemetry, Prometheus, Loki, Tempo, and Grafana, we have all the pieces to make that story visible.